Bruno Raimbault - Information Systems Engineer & Data Scientist
Email: raimbault.bruno@gmail.com - Github: braimbault
Current work is not included here. For more details, please consult my LinkedIn profile.
PSI - Connecting with Sara

[September 2020] The CwS platform aims to embrace the continuum of care: i. Initiate and maintain engagement from PSI project teams to Sara through her mobile phone. ii. Enable Sara to initiate engagement at her convenience through her mobile phone. Read the brief. @PSI
JHU - Air Pollution Modelling
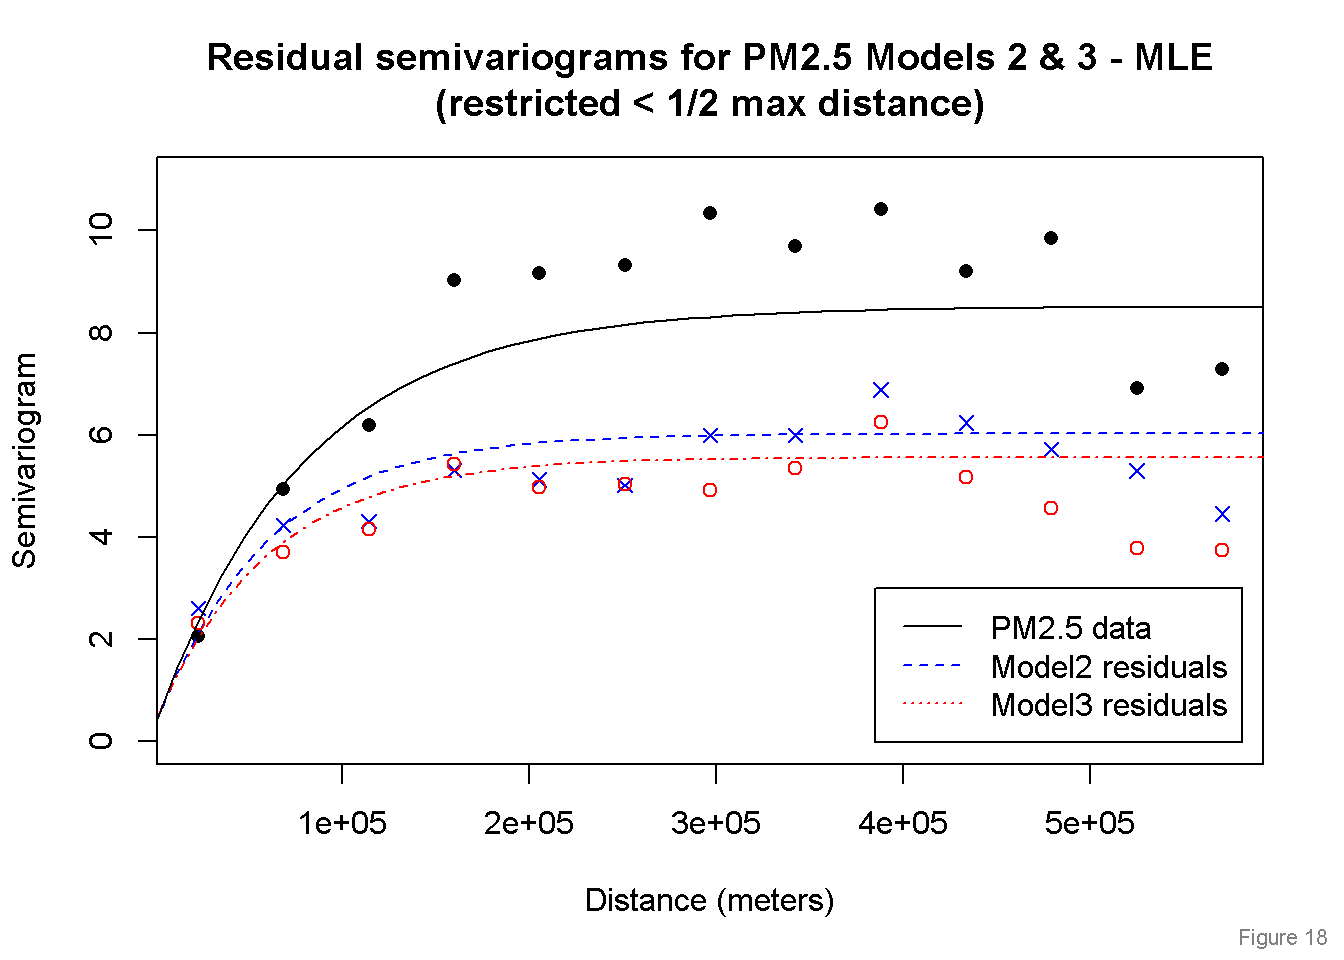
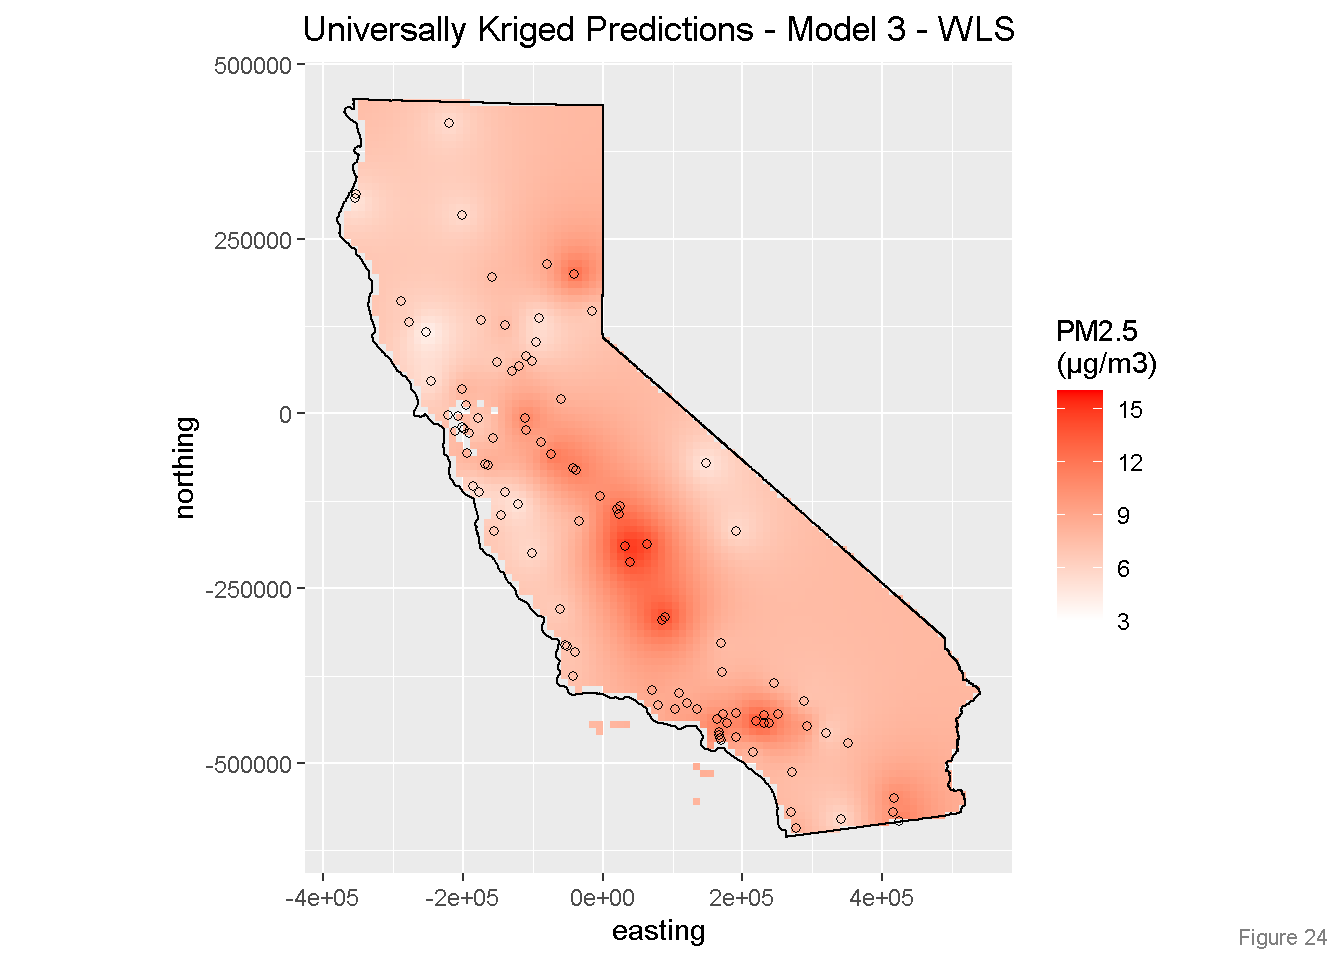
[May 2020] Characterizing the spatial distribution of annual PM2.5 across California. Exploration of multiple predictors and comparison of multiple Universal Kriging models performance. Built with R. @JHU
PSI - New Start App
[September 2017] Application to collect patient data during HIV testing campaings and enable follow-up on linkage to care. Connects to dhis2. @PSI
MSF - HMIS Dictionary App
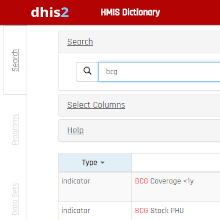
[December 2016] A dhis2 app to simplify user access to terminology and details associated with the health indicators. Check it on the dhis2 app store. NB: HMIS refers to Health Information Management System. Built with Angular.js for dhis2. @MSF-OCBA
MSF - Dashboards
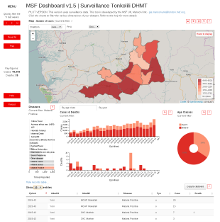
[April 2016] Dashboards for Medical Surveillance and Outbreak Data visualisation. Live examples: Tonkolili District, Sierra Leone (Surveillance) and Lubumbashi, DRC (Outbreak). Built with dc.js, leaflet.js and others. @MSF-UK
RC - Mapfolios
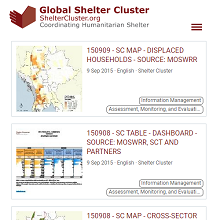
[August 2015] Browse the maps and data tables produced to support the Ethiopia RCS during the Drought Emergency Assessment and the Shelter Cluster during the Floods Response in Myanmar. Maps with QGIS, mapfolio from ARC with Dropbox. @GlobalShelterCluster, @BritishRedCross
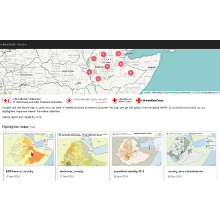
RC - Interactive Reports
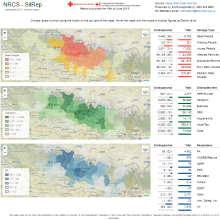
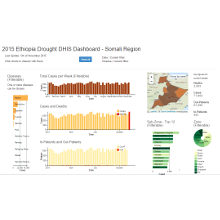
[June 2015] Dashboards to publish Situational Reports (SitRep) for the Nepal RCS Response to the Earthquake and Medical Surveillance Data (DHIS) for the Ethiopia RCS during the Drought Emergency Assessment. Built with dc.js and leaflet.js. @BritishRedCross
HDX - Open Humanitarian Data
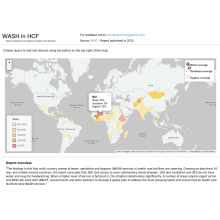
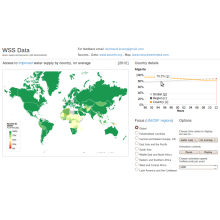
[March 2015] Simple dashboards for exploration of Open Humanitarian Data: i. WAter, Sanitation and Hygiene coverage in Health Care Facilities (WHO report) published in 2015. ii. Evolution of access to Water Supply and Sanitation by country (WSS). Built with leaflet.js and d3.js.
IRD - Irrigation Monitoring
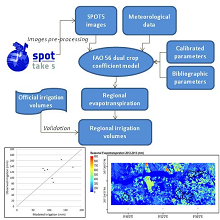
[June 2013] Monitoring Irrigation Consumption Using High Resolution NDVI Image Time Series: Calibration and Validation in the Kairouan Plain (Tunisia). Check the article. @IRD
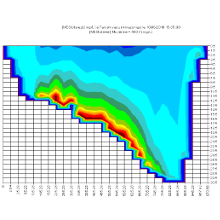
BRGM - Landslides Modelling
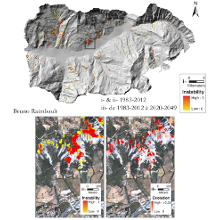
[June 2012] Quantitative approach to landslide hasard. Contributions to ALICE software. Built with VBA and SQL for MapInfo and Python for ArcGIS. @BRGM
IRD - Hydrological Analysis
[January 2011] Hydrological data management and analysis software. Contributions to Hydraccess software. Built with VBA and SQL for MS Access. @IRD